
We are launching a new dashboard to help you stay on top of sponsored research projects. It is a high-performance tool that brings key research metrics together in one place, making it easier to manage your portfolio and make timely, well-informed decisions. It’s the product of a great partnership between Research Operations and the Data & Analytics team, and it was designed with your needs squarely in mind. I’m confident this will be a valuable asset in your work, and I’m looking forward to seeing the many ways you’ll make the most of it! Your insights and feedback will shape how this tool will evolve—let’s build on it together!
What metrics does the Research Administration Metrics Dashboard include?
The metrics represented in the dashboard are sourced from Power BI. They are refreshed daily and, in most instances, give you access to the last five fiscal years. Not only can you access all information about prime awards, but also subcontracts, service agreements and biopharma awards.
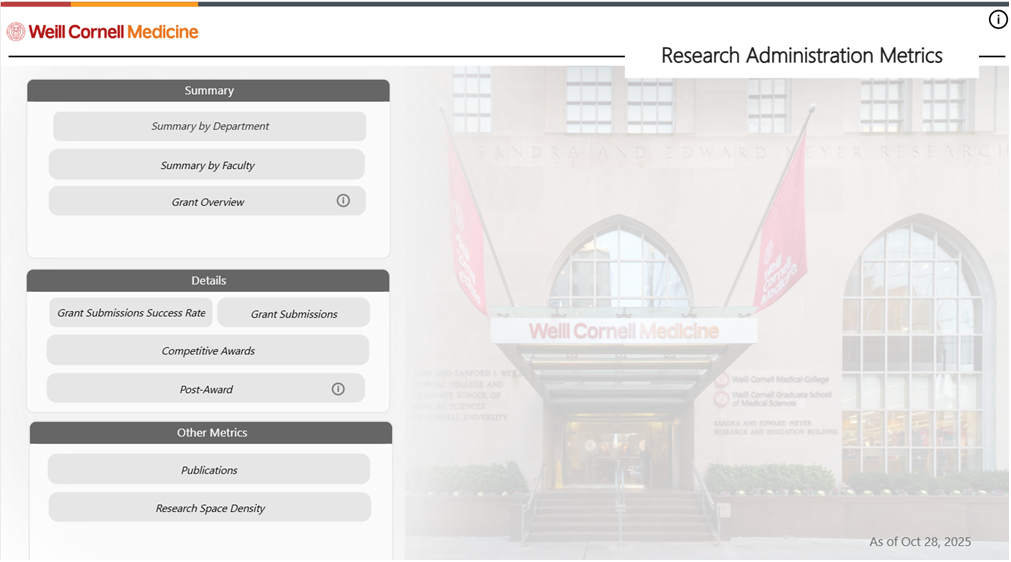
- Summary by Faculty: Critical metrics shown are faculty awards and budgets, along with the current spending.
- Grant Submissions Success Rate: Success rate is defined by NIH as the percentage of reviewed grant applications that receive funding. It is determined by dividing the number of competing applications funded by the sum of the total number of competing applications.
- Grant Submissions: Metrics include the funding agency, the grant title, and the requested project costs.
- Competitive Awards: Refers to the initial year of grants or contracts awarded through a merit-based application and review process, where proposals are evaluated and ranked against others based on specific criteria.
- Post-Award: Financial information about all awards.
- Publications: Summary of publications.
- Research Space Density: A comprehensive static annual review of wet and damp laboratory research space based on space allocation, space quality, and funding with an overarching institutional goal of $200 IDC/sq ft.
- Information: Definition of all metrics displayed in the dashboard
How can you access the Dashboard?
- Log into app.powerbi.com
- Click Apps
- Click the Research Administration Metrics Dashboard tile
Learning materials
- Research Administration Metrics Job Aid
- Navigational Job Aid: Accessing Power BI Dashboards
- Visit the Power BI page on the ITS website
- Power BI Quick Tip video playlist
Questions
If you have any questions about the new Research Administration Metrics Dashboard or anything else in Power BI, please email DnASupport@med.cornell.edu.