
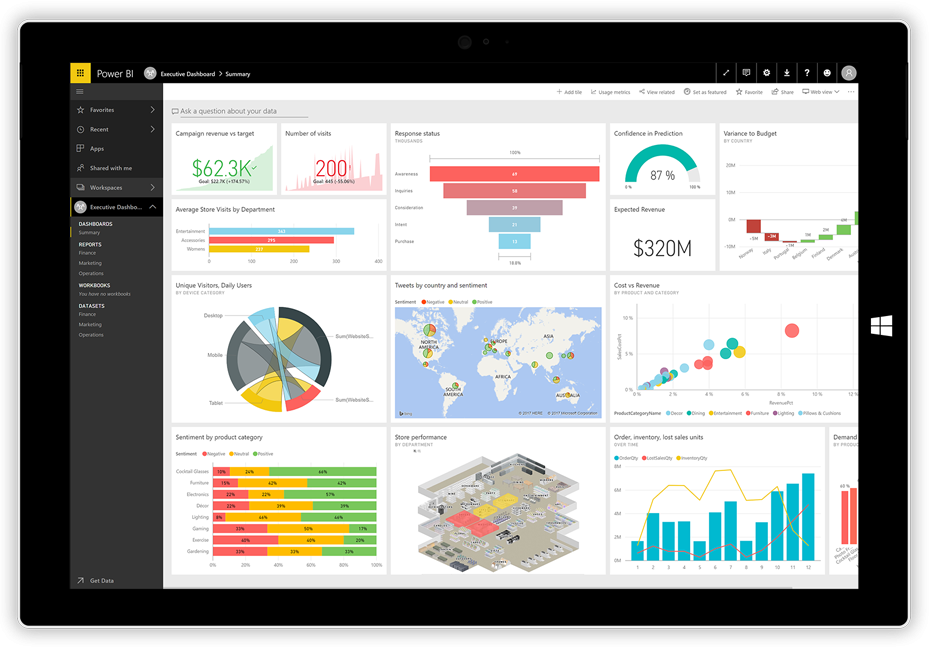
Make your data easier to interpret using Power BI, WCM’s official data visualization tool. Create charts, maps, and models by simply uploading data from Excel or other databases into Power BI and selecting from an extensive visualizations list.
Whether you’re a financial analyst or a researcher, Power BI will help you to create a narrative around your data and tell a compelling visual story.
Video: What is Power BI?
What's Included
Currently, ITS supports the desktop version of Power BI and a web-based version, Power BI online. Power BI allows you to:
- Connect to large data sets and a wide range of data sources
- Clean and prepare data using visual tools
- Analyze and build stunning reports with custom visualizations
Service Requirements
At this time, the free desktop version of Power BI is available for Windows users with the following operating systems:
- Windows 11
Microsoft Power BI Desktop requires Internet Explorer 10 or greater and is available for 32-bit and 64-bit platforms.